![Hospital Software ROI: Calculate Benefits & Justify Your Investment [2026]](/_next/image?url=%2Finfographics%2Fhospital-software-roi-benefits.png&w=2048&q=75)
Hospital management software isn't just an expense—it's an investment that pays dividends. Understanding the ROI helps you make informed decisions and justify the investment to stakeholders.
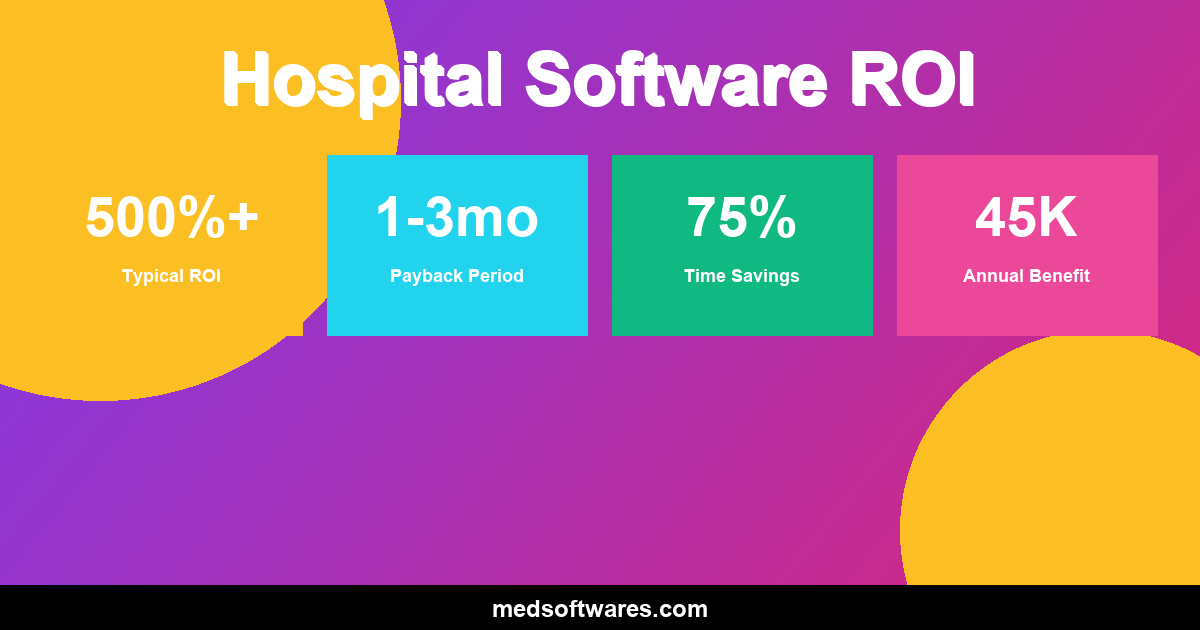
Typical ROI Ranges
| Hospital Size | Investment | Annual Savings | ROI | Payback Period | |---------------|------------|----------------|-----|----------------| | Small clinic (<20 beds) | $799-$5,000 | $5,000-$20,000 | 300-500% | 1-3 months | | Community hospital (20-100 beds) | $1,500-$50,000 | $50,000-$200,000 | 200-400% | 3-6 months | | Regional hospital (100-300 beds) | $5,000-$500,000 | $200,000-$1,000,000 | 100-300% | 6-18 months | | Large hospital (300+ beds) | $500,000-$50,000,000 | $2,000,000-$20,000,000 | 50-200% | 1-5 years |
Where ROI Comes From
1. Staff Efficiency Gains
Time Savings:
| Task | Manual Time | With HMS | Time Saved | |------|-------------|----------|------------| | Patient registration | 15-20 min | 3-5 min | 75% | | Finding records | 10-15 min | 30 sec | 97% | | Appointment scheduling | 10 min | 2 min | 80% | | Billing preparation | 30 min | 5 min | 83% | | Report generation | 2-4 hours | 5 min | 97% |
Financial Impact:
- Average nurse hourly rate: $35-$50
- Average admin hourly rate: $20-$30
- 2 hours saved per staff per day = $15,000-$25,000/year per FTE
Example Calculation:
- 20 clinical staff × 1.5 hours saved/day × $40/hour × 250 days
- = $300,000 annual staff efficiency savings
2. Revenue Cycle Improvements
Billing Accuracy:
| Metric | Before HMS | After HMS | Improvement | |--------|-----------|-----------|-------------| | Clean claim rate | 70-80% | 92-98% | 15-25% | | Days in A/R | 45-60 days | 25-35 days | 40% faster | | Denial rate | 10-15% | 3-5% | 70% reduction | | Revenue captured | 85-90% | 95-99% | 5-10% increase |
Financial Impact:
- 5% revenue increase on $5M annual billing = $250,000
- Faster collections improve cash flow
- Reduced write-offs increase profitability
3. Inventory Optimization
Medication & Supply Savings:
| Area | Before HMS | After HMS | Savings | |------|-----------|-----------|---------| | Medication waste | 15-25% | 3-5% | 15-20% | | Stock-outs | Weekly | Rare | Emergency purchase costs | | Overstock | 20-30% extra | 5-10% buffer | 15-20% | | Expiration losses | 5-10% | Under 2% | 5-8% |
Example Calculation:
- Annual inventory spend: $500,000
- 15% reduction through optimization
- = $75,000 annual inventory savings
4. Error Reduction
Clinical Error Savings:
| Error Type | Reduction | Potential Savings | |------------|-----------|-------------------| | Medication errors | 50-80% | Avoid $5,000-$50,000 per incident | | Billing errors | 70-90% | Avoid $500-$5,000 per error | | Documentation gaps | 80-95% | Avoid compliance fines | | Duplicate tests | 60-80% | Save $50-$500 per avoided test |
Risk Avoidance Value:
- Single serious medication error can cost $100,000+
- Compliance violations: $10,000-$100,000+ fines
- Malpractice risk reduction: Immeasurable value
5. Patient Volume Increase
Throughput Improvements:
| Metric | Improvement | Impact | |--------|-------------|--------| | Patient wait time | -30-50% | Higher satisfaction | | Daily patient capacity | +15-30% | More revenue | | Appointment no-shows | -20-40% | Better scheduling | | Bed turnover | +10-20% | More admissions |
Financial Impact:
- 20% more outpatients × $100 average revenue = significant growth
- Better reviews lead to more referrals
- Competitive advantage in the market
ROI Calculator: Your Hospital
Input Your Numbers
Current State:
- Annual revenue: $________
- Staff count (clinical): ________
- Staff count (admin): ________
- Annual inventory spend: $________
- Average billing errors/month: ________
HMS Investment:
- One-time cost: $________
- Annual fees (if any): $________
- Implementation cost: $________
Calculate Your Returns
Staff Efficiency:
- Clinical staff × 1 hour saved × $40 × 250 days = $________
- Admin staff × 2 hours saved × $25 × 250 days = $________
Revenue Improvement:
- Annual revenue × 5% improvement = $________
Inventory Savings:
- Annual inventory × 15% reduction = $________
Total Annual Benefits: $________
ROI: (Annual Benefits - Annual Cost) / Total Investment × 100 = ________%
Payback Period: Total Investment / Monthly Benefits = ________ months
HospitalOS ROI Example
Scenario: 50-Bed Community Hospital
Investment:
- HospitalOS Standard: $1,499 (one-time)
- Hardware: $2,000 (computers, printers)
- Training: $0 (included)
- Annual fees: $0
- Total Investment: $3,499
Year 1 Benefits:
| Category | Calculation | Value | |----------|-------------|-------| | Staff efficiency | 30 staff × 1 hr × $30 × 250 days | $225,000 | | Revenue improvement | $3M × 3% | $90,000 | | Inventory savings | $200K × 10% | $20,000 | | Error reduction | 20 errors avoided × $500 | $10,000 | | Total Year 1 Benefits | | $345,000 |
ROI Calculation:
- ROI = ($345,000 - $0) / $3,499 × 100 = 9,860%
- Payback = $3,499 / ($345,000 / 12) = 0.12 months (under 4 days)
Compare to Subscription Alternative
| Factor | HospitalOS | $500/mo Subscription | |--------|------------|---------------------| | 5-Year Cost | $3,499 | $30,000 | | 5-Year Benefits | $1,725,000 | $1,725,000 | | 5-Year Net ROI | $1,721,501 | $1,695,000 | | ROI Percentage | 49,200% | 5,650% |
HospitalOS delivers 8.7x better ROI.
Building Your Business Case
For Hospital Leadership
Executive Summary Template:
"Implementing [HospitalOS/HMS] requires a $[X] investment with expected annual returns of $[Y], delivering [Z]% ROI with payback in [N] months."
Key Points to Emphasize:
- Quantified financial returns
- Risk mitigation value
- Competitive necessity
- Staff satisfaction impact
- Patient care improvements
For the Finance Committee
Financial Justification Framework:
| Line Item | Year 1 | Year 2 | Year 3 | Year 4 | Year 5 | |-----------|--------|--------|--------|--------|--------| | Investment | $3,499 | $0 | $0 | $0 | $0 | | Benefits | $345,000 | $360,000 | $375,000 | $390,000 | $405,000 | | Net Value | $341,501 | $360,000 | $375,000 | $390,000 | $405,000 | | Cumulative | $341,501 | $701,501 | $1,076,501 | $1,466,501 | $1,871,501 |
For Clinical Staff
Operational Benefits:
- Less paperwork: Focus on patients, not charts
- Faster access: Patient info in seconds
- Better decisions: Complete history available
- Fewer errors: Built-in safety checks
- Less stress: Organized workflow
ROI by Hospital Type
Small Clinics
Best ROI Drivers:
- Staff efficiency (biggest impact)
- Billing accuracy
- Inventory control
- Patient scheduling
Typical Results:
- Investment: $799-$2,500
- Annual savings: $20,000-$50,000
- ROI: 800-2,000%
Community Hospitals
Best ROI Drivers:
- Revenue cycle improvements
- Staff productivity
- Inventory optimization
- Quality reporting
Typical Results:
- Investment: $1,500-$50,000
- Annual savings: $100,000-$500,000
- ROI: 300-1,000%
Large Facilities
Best ROI Drivers:
- Enterprise-wide standardization
- Data analytics insights
- Integration efficiency
- Compliance automation
Typical Results:
- Investment: $500,000-$50,000,000
- Annual savings: $2,000,000-$50,000,000
- ROI: 100-400%
Beyond Financial ROI
Quality Improvements
| Metric | Typical Improvement | |--------|---------------------| | Patient satisfaction scores | +15-30% | | Clinical quality indicators | +10-25% | | Compliance audit scores | +20-40% | | Staff satisfaction | +20-35% |
Strategic Value
- Competitive positioning: Modern facilities attract patients
- Accreditation support: Easier certification compliance
- Growth enablement: Scale without proportional staff
- Data insights: Make informed strategic decisions
Risk Mitigation
- Compliance protection: Avoid regulatory penalties
- Audit readiness: Complete documentation
- Malpractice defense: Clear clinical records
- Disaster recovery: Protected patient data
Common ROI Mistakes to Avoid
1. Underestimating Benefits
Don't just count obvious savings. Include:
- Time savings across ALL departments
- Revenue capture improvements
- Quality-related cost avoidance
- Staff retention benefits
2. Overestimating Implementation Costs
With solutions like HospitalOS:
- No hidden implementation fees
- Training included
- Updates included
- Support included
3. Ignoring Opportunity Costs
What does NOT implementing cost you?
- Continued inefficiency
- Lost revenue
- Staff frustration
- Competitive disadvantage
4. Short-Term Thinking
Calculate 5-year TCO, not just year 1:
- Subscription fees compound
- One-time purchases don't
- Long-term value matters most
Get Your Custom ROI Analysis
Free ROI Assessment
Contact us for a personalized ROI analysis for your facility:
- Share your current state: Size, volume, challenges
- Receive custom projections: Based on your specific data
- Compare options: HospitalOS vs. alternatives
- Make informed decisions: Data-driven choices
Frequently Asked Questions
How long until we see ROI?
Most hospitals see positive ROI within 1-6 months. With low-cost solutions like HospitalOS, payback can be under 30 days.
What if we're already efficient?
Even efficient hospitals find 10-20% improvement opportunities. The question isn't IF there's room for improvement, but WHERE.
Is ROI guaranteed?
No vendor can guarantee specific results. However, hospitals consistently report significant improvements. Request references from similar facilities.
How do we measure ROI after implementation?
Track metrics before and after:
- Staff hours per patient
- Days in A/R
- Clean claim rate
- Inventory turns
- Patient satisfaction
Conclusion
Hospital software ROI is real and measurable. With solutions like HospitalOS starting at $799, the question isn't whether you can afford to implement—it's whether you can afford not to.
The math is clear:
- Investment: $799-$4,999
- Typical annual return: $20,000-$500,000+
- ROI: 500-10,000%+
- Payback: Days to months
Stop losing money to inefficiency.
![Healthcare Cybersecurity for Hospitals: Complete Protection Guide [2026]](/_next/image?url=%2Finfographics%2Fhealthcare-cybersecurity-stats-2026.png&w=2048&q=75)
![Hospital Billing Software: Complete Guide to Revenue Cycle Management [2026]](/_next/image?url=%2Finfographics%2Fhospital-billing-features.png&w=2048&q=75)
![Hospital Software Implementation Guide: 5 Steps to Success [2026]](/_next/image?url=%2Finfographics%2Fimplementation-timeline.png&w=2048&q=75)